Azure Monitor
Introduction
Azure Monitor Logs is the log management service of Microsoft Azure. FlowG can upload its log records to a Log Analytics workspace, so they can be queried with KQL, alerted on, and analyzed alongside the rest of your Azure telemetry.
Setting up Azure Monitor
FlowG sends its records to the Logs Ingestion API, which requires:
- a Log Analytics workspace, with a custom table to store the logs
- a Data Collection Endpoint (DCE), which FlowG uploads the records to
- a Data Collection Rule (DCR), which declares the schema of the records and routes them to the table
First, create the resource group, then the workspace and the custom table:
az group create \
  --name testing \
  --location northeurope

az monitor log-analytics workspace create \
  --resource-group testing \
  --workspace-name flowg

az monitor log-analytics workspace table create \
  --resource-group testing \
  --workspace-name flowg \
  --name flowg_CL \
  --columns \
    TimeGenerated=datetime \
    content=string \
    hostname=string \
    tag=string \
    severity=string \
    facility=string
- The examples creates a resource group named
testing, located innortheurope. Adjust according to your setup. - The name of a custom table always ends with the
_CLsuffix.
Then, create the Data Collection Endpoint:
az monitor data-collection endpoint create \
  --resource-group testing \
  --name flowg \
  --location northeurope \
  --public-network-access Enabled
The command returns the URL FlowG will upload the records to, in the
logsIngestion property:
{
  "logsIngestion": {
    "endpoint": "https://flowg-a1b2.northeurope-1.ingest.monitor.azure.com"
  }
}
- The
logsIngestionendpoint URL displayed above is an example. Your actual endpoint URL will differ and should be used in the Data Collection Rule configuration.
Then, create the Data Collection Rule. It declares the fields FlowG sends in an input stream, and maps that stream to the table created earlier. Fetch the IDs of the endpoint and the workspace first:
az monitor data-collection endpoint show \
  --resource-group testing \
  --name flowg \
  --query id -o tsv

az monitor log-analytics workspace show \
  --resource-group testing \
  --workspace-name flowg \
  --query id -o tsv
And write the rule definition in a dcr.json file:
{
  "properties": {
    "dataCollectionEndpointId": "<ID of the Data Collection Endpoint>",
    "streamDeclarations": {
      "Custom-flowg_CL": {
        "columns": [
          { "name": "content", "type": "string" },
          { "name": "hostname", "type": "string" },
          { "name": "tag", "type": "string" },
          { "name": "severity", "type": "string" },
          { "name": "facility", "type": "string" }
        ]
      }
    },
    "destinations": {
      "logAnalytics": [
        {
          "name": "workspace",
          "workspaceResourceId": "<ID of the Log Analytics workspace>"
        }
      ]
    },
    "dataFlows": [
      {
        "streams": ["Custom-flowg_CL"],
        "destinations": ["workspace"],
        "transformKql": "source | extend TimeGenerated = now()",
        "outputStream": "Custom-flowg_CL"
      }
    ]
  }
}
az monitor data-collection rule create \
  --resource-group testing \
  --name flowg \
  --location northeurope \
  --rule-file dcr.json
- The location MUST match the location of the Data Collection Endpoint.
FlowG targets the rule by its immutable ID, which you can fetch with:
az monitor data-collection rule show \
  --resource-group testing \
  --name flowg \
  --query immutableId -o tsv
Which returns something like dcr-0123456789abcdef0123456789abcdef.
Finally, FlowG authenticates to the ingestion endpoint with a Microsoft Entra ID access token.
We first need to create the service principal:
APP_ID=$(
  az ad app create --display-name flowg-azure-monitor \
  | jq -r '.appId'
)

az ad sp create --id "$APP_ID"

az ad app credential reset \
  --id "$APP_ID" \
  --append \
  --display-name flowg-secret
Which outputs:
{
  "appId": "<APP_ID>",
  "password": "<PASSWORD>",
  "tenant": "<TENANT_ID>"
}
Then grant the "Monitoring Metrics Publisher" role on the rule to the identity you will request the token with:
DCR_ID=$(az monitor data-collection rule show \
  --resource-group testing \
  --name flowg \
  --query id -o tsv)

az role assignment create \
  --assignee "$APP_ID" \
  --role "Monitoring Metrics Publisher" \
  --scope "$DCR_ID"
Then, request a token for that identity:
az login --service-principal \
  --username "$APP_ID" \
  --password "<password>" \
  --tenant "<tenant-id>"

az account get-access-token \
  --resource https://monitor.azure.com
{
  "accessToken": "eyJ0eXAiOiJKV1QiLCJhbGci...",
  "expiresOn": "2026-08-11 17:04:05.000000",
  "expires_on": 1786460645,
  "subscription": "...",
  "tenant": "...",
  "tokenType": "Bearer"
}
FlowG expects the expiry date in RFC3339 format. The expiresOn property is in
your local timezone, so convert the expires_on UNIX timestamp instead:
date -u -d @1786460645 +%Y-%m-%dT%H:%M:%SZ
Which gives 2026-08-11T15:04:05Z.
Microsoft Entra ID access tokens are short-lived (about an hour by default). FlowG authenticates with this static token and does not renew it: once it expires, the forwarder configuration must be updated with a fresh one, for example by a scheduled job calling the FlowG API.
Setting up the FlowG pipeline
First, let's create an "Azure Monitor Forwarder" named azure, with the
following configuration:
Then, create a pipeline that forwards logs received via Syslog to the azure
forwarder:
And that's it!
Testing
You can test the setup by sending a log to the pipeline using the logger
command:
logger --rfc3164 -n localhost -P 5514 -t myapp1 'hello world'
You can then query the logs back with:
WORKSPACE_ID=$(az monitor log-analytics workspace show \
  --resource-group testing \
  --workspace-name flowg \
  --query customerId -o tsv)

az monitor log-analytics query \
  --workspace "$WORKSPACE_ID" \
  --analytics-query 'flowg_CL | take 10'
- We assume you are logged in NOT with the service principal we created earlier.
Or find them in the Azure portal, in the "Logs" tab of the Log Analytics workspace, with the following KQL query:
flowg_CL
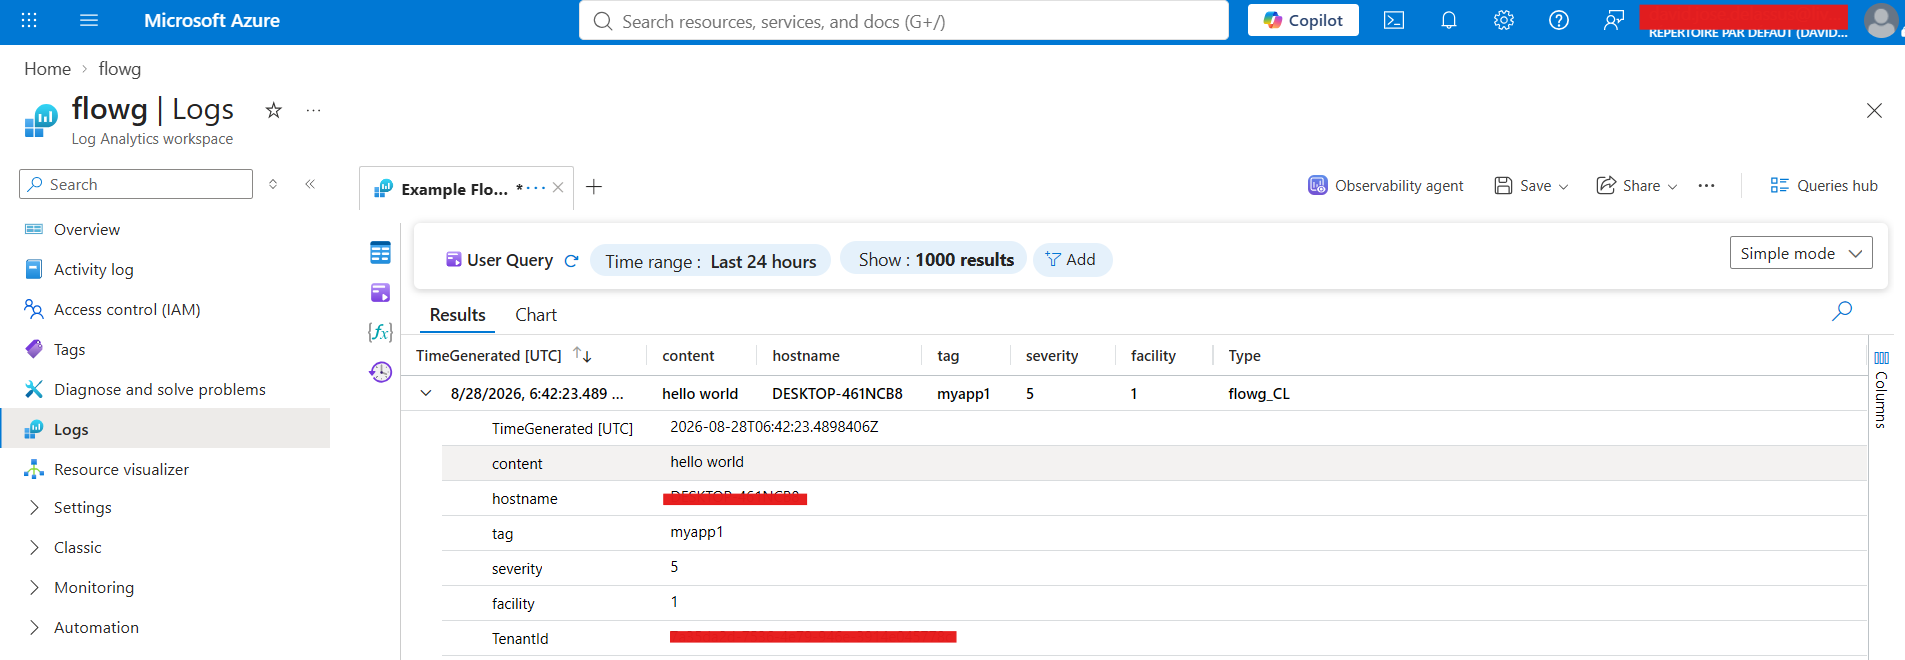
The first records can take a few minutes to show up after the creation of the table and the rule.
The fields of the log record are sent as a JSON object to the Logs Ingestion
API. Only the columns declared in the input stream of the DCR reach the table,
other fields are dropped. The TimeGenerated column is set at ingestion time
by the rule's transformation, FlowG does not send the record's timestamp.