Turning your logs into metrics

Logs tell you what happened. Metrics tell you how much, how often, and is it getting worse. Most infrastructures pay for both, twice, with two different agents reading the same lines.
Since FlowG v0.62.0, they can share the work: a pipeline is now able to count the records flowing through it, and expose those counters to Prometheus.
Two questions, two costs
Show me the stack trace of the request that failed at 14:32
This is a question for logs. You need the full payload, and you need it exactly once.
Did the error rate of the checkout service triple in the last ten minutes?
This is a different question entirely. You do not need a single log line to answer it, you need one number, sampled regularly. And yet, in most setups, that question is answered by running a text search over hundreds of gigabytes, every thirty seconds, on a dashboard nobody is looking at.
That is the expensive way of doing it.
The interesting part is that FlowG already has the answer. Your pipeline parses every record, splits it, classifies it, decides that this one is an error coming from that component, and then routes it to a stream. All that classification work is done, and then thrown away.
Metric nodes let you keep a cheap, numeric shadow of it.
The metric node
A metric node does exactly one thing: it increments a counter for every record that reaches it. Its only configuration is a name.
It is a terminal node, like routers and forwarders: records go in, nothing comes out. So you do not insert it in your flow, you branch off it. Any node can fan out to a router and to one or more metric nodes, and the record is processed by all of them concurrently.
Here is a pipeline that stores everything, and counts a few things on the side
(syslog severity 3 being error):
The name you pick becomes the metric name, prefixed with the node namespace:
errors_total is exported as node_errors_total.
Prometheus conventions still apply, and nothing enforces them for you. Suffix
your counters with _total, keep them in snake_case, and pick a naming
scheme rather than naming each node ad-hoc: here, every per-component counter
is called <component>_logs_total. We will exploit that scheme in a minute.
The per-pipeline exporter
Every pipeline exposes its own Prometheus exporter:
curl -s \
  -H "Authorization: Bearer ${FLOWG_TOKEN}" \
  http://localhost:5080/api/v1/pipelines/ingress/metrics
# HELP pipeline_logs_total Total number of logs processed by the pipeline since startup
# TYPE pipeline_logs_total counter
pipeline_logs_total 128374
# HELP node_errors_total Number of logs measured since startup
# TYPE node_errors_total counter
node_errors_total 812
# HELP node_nginx_logs_total Number of logs measured since startup
# TYPE node_nginx_logs_total counter
node_nginx_logs_total 96110
Two things to notice.
First, pipeline_logs_total is there for free. You do not have to draw anything
to get the total volume of a pipeline.
Second, the endpoint is authenticated, and requires the read_pipelines
scope. It lives on the regular API, not on the management interface. This is
deliberate: the /metrics endpoint on port 9113 is about monitoring
FlowG itself (goroutines, heap, ingestion counters), while the per-pipeline
exporter is about monitoring the infrastructure FlowG collects logs for.
Different audiences, different blast radius, different firewall rules.
They start at zero when the pipeline is built, which happens on server startup
and every time you save the pipeline. Prometheus detects counter resets on its
own, so rate() and increase() stay correct across restarts, just do not
build anything on the raw counter value.
Wiring the whole thing
Let's build the stack. First, a scraper identity: a role with the single scope it needs, a user bound to that role, and a personal access token.
# create the role and the user through the UI or the API, then:
flowg-client token create
Store the token where Prometheus can read it, and nowhere else:
install -m 0600 /dev/null ./secrets/flowg-token
printf '%s' "${FLOWG_TOKEN}" > ./secrets/flowg-token
Then the stack itself:
services:
  flowg:
    image: linksociety/flowg:latest
    ports:
      - "5080:5080/tcp"
      - "5514:5514/udp"
    volumes:
      - flowg-data:/data

  prometheus:
    image: prom/prometheus:latest
    command:
      - --config.file=/etc/prometheus/prometheus.yml
    volumes:
      - ./prometheus.yml:/etc/prometheus/prometheus.yml:ro
      - ./rules.yml:/etc/prometheus/rules.yml:ro
      - ./secrets/flowg-token:/etc/prometheus/flowg-token:ro
    ports:
      - "9090:9090"

  alertmanager:
    image: prom/alertmanager:latest
    volumes:
      - ./alertmanager.yml:/etc/alertmanager/alertmanager.yml:ro
    ports:
      - "9093:9093"

  grafana:
    image: grafana/grafana:latest
    volumes:
      - ./grafana/provisioning:/etc/grafana/provisioning:ro
    ports:
      - "3000:3000"

volumes:
  flowg-data:
Now the interesting file. Since the metrics path carries the pipeline name, we
use relabeling to build it from a label, which also means the pipeline label
ends up on every series (something the exporter itself cannot know):
global:
  scrape_interval: 30s

rule_files:
  - /etc/prometheus/rules.yml

alerting:
  alertmanagers:
    - static_configs:
        - targets: ["alertmanager:9093"]

scrape_configs:
  - job_name: flowg-pipelines
    authorization:
      type: Bearer
      credentials_file: /etc/prometheus/flowg-token
    static_configs:
      - targets: ["flowg:5080"]
        labels:
          pipeline: ingress
      - targets: ["flowg:5080"]
        labels:
          pipeline: applications
    relabel_configs:
      - source_labels: [pipeline]
        target_label: __metrics_path__
        replacement: /api/v1/pipelines/$1/metrics

    metric_relabel_configs:
      # node_nginx_logs_total -> flowg_component_logs_total{component="nginx"}
      - source_labels: [__name__]
        regex: node_(.+)_logs_total
        target_label: component
        replacement: $1
      - source_labels: [__name__]
        regex: node_(.+)_logs_total
        target_label: __name__
        replacement: flowg_component_logs_total
That second block is the payoff of picking a naming scheme. Metric nodes export
unlabeled counters, one time series per node. With four lines of relabeling,
a family of node_*_logs_total counters collapses into a single metric with a
component label, which is what you actually want to aggregate over. Note that
node_errors_total and pipeline_logs_total do not match the pattern, so they
travel through untouched.
Rewrite the component label before rewriting __name__. Once the name is
replaced, the regex of the second rule no longer matches anything.
PromQL: asking the right questions
How many logs per second, per pipeline?
sum by (pipeline) (rate(pipeline_logs_total[5m]))
Which components are the most verbose? The classic "who is filling up my disk" question, now answered in milliseconds instead of a full text scan:
topk(10, sum by (component) (rate(flowg_component_logs_total[5m])))
Which components went quiet? Far more interesting, and far harder to notice by eye. A component that suddenly stops logging is either dead, misconfigured, or being tampered with:
bottomk(10,
  sum by (component) (increase(flowg_component_logs_total[1h]))
)
What proportion of logs are errors? Ratios are where counters shine, because volume cancels out (a deploy that doubles traffic does not move this number):
  sum by (pipeline) (rate(node_errors_total[5m]))
/
  sum by (pipeline) (rate(pipeline_logs_total[5m]))
Is this a spike, or just Monday morning? Compare the current rate against its own recent baseline rather than against a hardcoded threshold:
  sum by (pipeline) (rate(pipeline_logs_total[5m]))
/
  avg_over_time(
    sum by (pipeline) (rate(pipeline_logs_total[5m]))[1d:5m]
  )
That subquery is expensive to evaluate on every dashboard refresh, so let's precompute it.
Alerting on spikes and silence
Recording rules first, to keep the alert expressions readable and cheap:
groups:
  - name: flowg.recording
    interval: 30s
    rules:
      - record: flowg:pipeline_logs:rate5m
        expr: sum by (pipeline) (rate(pipeline_logs_total[5m]))

      - record: flowg:component_logs:rate5m
        expr: sum by (pipeline, component) (rate(flowg_component_logs_total[5m]))

      - record: flowg:pipeline_logs:rate5m:baseline1d
        expr: avg_over_time(flowg:pipeline_logs:rate5m[1d])
Then the alerts:
  - name: flowg.alerts
    rules:
      - alert: LogIngestionSpike
        expr: |
          flowg:pipeline_logs:rate5m
            > 3 * flowg:pipeline_logs:rate5m:baseline1d
          and flowg:pipeline_logs:rate5m > 50
        for: 10m
        labels:
          severity: warning
        annotations:
          summary: "Pipeline {{ $labels.pipeline }} is ingesting 3x its usual volume"
          description: "Currently {{ $value | printf \"%.1f\" }} logs/s."

      - alert: ComponentWentSilent
        expr: |
          flowg:component_logs:rate5m == 0
          and flowg:component_logs:rate5m offset 1h > 0
        for: 15m
        labels:
          severity: critical
        annotations:
          summary: "{{ $labels.component }} stopped sending logs"

      - alert: AuthenticationFailureBurst
        expr: rate(node_authfail_total[5m]) > 5
        for: 5m
        labels:
          severity: critical
          team: security
        annotations:
          summary: "Sustained authentication failures across the fleet"
That last one assumes a transformer that tags authentication failures with an
event field, and a switch feeding its own metric node, exactly the same
pattern as the diagram above, one branch further down.
The and ... > 50 guard on the first alert is not decoration: without it, a
pipeline that normally sees 0.1 logs/s will page you every time it sees three.
Relative thresholds need an absolute floor.
ComponentWentSilent is the one I would keep if I could only keep one. It is a
dead man's switch for your observability itself, and it costs a single metric
node per component. A crashed sidecar, a full disk on the log shipper, a rotated
certificate on the syslog listener, or someone quietly turning logging off: all
of them look identical from Prometheus' point of view, and all of them are worth
a page.
Finally, route them:
route:
  group_by: [alertname, pipeline]
  group_wait: 30s
  group_interval: 5m
  repeat_interval: 4h
  receiver: platform
  routes:
    - matchers: [team = "security"]
      receiver: security
      continue: false

receivers:
  - name: platform
    slack_configs:
      - channel: "#alerts-platform"
  - name: security
    slack_configs:
      - channel: "#alerts-security"
Charting it
Provision the datasource so the whole thing stays reproducible:
apiVersion: 1
datasources:
  - name: Prometheus
    type: prometheus
    access: proxy
    url: http://prometheus:9090
    isDefault: true
Then, four panels that cover most of what you'll want to look at:
- Ingestion rate: a time series of
sum by (pipeline) (rate(pipeline_logs_total[$__rate_interval])), unitlogs/sec. Use$__rate_intervalrather than a hardcoded[5m], otherwise your graph lies to you when you zoom out. - Top talkers: a bar gauge of
topk(10, sum by (component) (rate(flowg_component_logs_total[$__rate_interval]))). This is the panel your finance team will care about. - Silence detector: a table of
sum by (component) (increase(flowg_component_logs_total[1h])), sorted ascending, with a red threshold at0. - Error ratio: a stat panel with the ratio expression from earlier, unit
percentunit, thresholds at 1% and 5%.
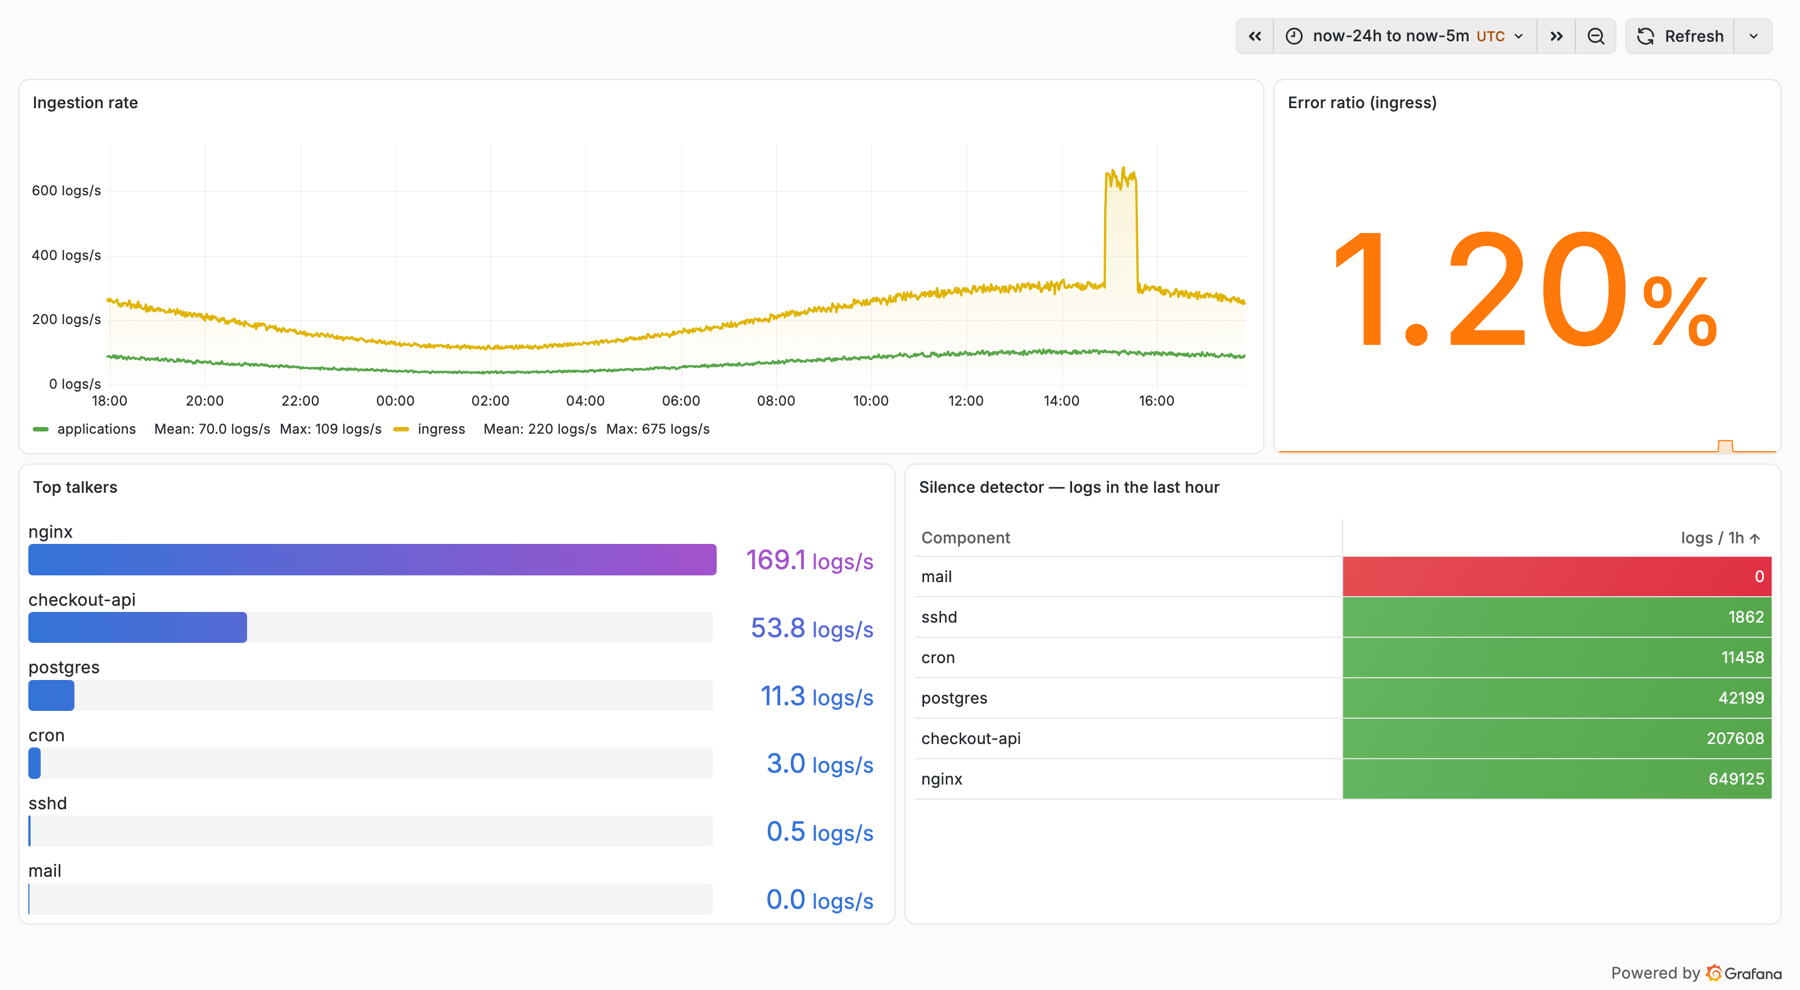
The spike at 15:00 is the checkout-api incident, and mail sitting at zero
for the last hour is a component that stopped talking, both of them read at a
glance, from counters that cost nothing to collect.
Because every series carries the pipeline and component labels we
synthesized during relabeling, a single dashboard variable
(label_values(flowg_component_logs_total, component)) turns all of this into a
per-component drill-down for free.
Giving logs a second life
None of this replaces your logs. When an alert fires, you still open FlowG, query the stream, and read the actual lines.
But it changes what logs are worth. A pipeline you built to route records into streams turns out to be, almost for free, a classification engine, and a classification engine that emits numbers is a metrics pipeline. Every branch you already drew to decide where a log goes can now also answer how many.
One graph edge, one counter, one dashboard panel.
Give it a try, and as always, feedback is very welcome, either on GitHub or on Discord.
\_o< {counting quacks}